Jeremy S. Wu, Ph. D. (Jeremy.S.Wu@gmail.com)
Mark Lin (marklindata@gmail.com)
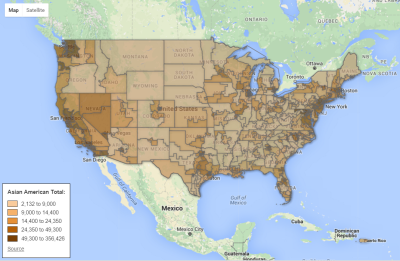
An interactive map to visualize the distribution of Asian American populations by Congressional District is now available at http://bit.ly/2014AAbyCD. The user may move and zoom in and out of the map and view the following results by pointing and clicking at any location in the United States:
- State and Congressional District
- Name of incumbent U.S. House Representative and political party affiliation (D=Democrat and R=Republican)
- Total Asian American population in the district and
Asian Indian, Chinese, Filipino, Japanese, Korean, Vietnamese, and Other Asians
Males and females
Percentages of males and females age 18 and over
The interactive map is color-coded by 5 approximately equal-size groups. The darker the color, the higher the number of Asian Americans.
These results are available for 437 locations based on 2014 data – 435 Congressional Districts, the District of Columbia, and Puerto Rico. The U.S. representatives serve a term of 2 years. The next general election will be held on November 8, 2016.According to the 2014 U.S. Census Bureau estimates, there were 15.7 million Asian Americans in the U.S. (not including Puerto Rico), among them are 23.5% Chinese, 19.8% Asian Indian, 16.9% Filipino, 10.7% Vietnamese, 9.3% Korean and 5.0% Japanese. Males represent 47.4% and females 52.6%. Age 18 and over make up 78.8%.
The U.S. Congresspersons currently representing the most Asian Americans are:
| Democrat(Asian American population) | Republican(Asian American population) |
|---|---|
| CA-27 Mike Honda (369,707) | CA-39 Ed Royce (210,474) |
| HI-1 Mark Takai (352,499) | CA-45 Mimi Walters (158,705) |
| NY-6 Grace Meng (276,924) | CA-48 Dana Rohrabacher (127,556) |
| CA-27 Judy Chu (264,289) | TX-22 Pete Olson (127,087) |
| CA-14 Jackie Speier (231,314) | TX-3 Sam Johnson (96,980) |
Among the 435 U.S. Representatives, three are Chinese Americans:
Data Sources
The interactive map based on 2014 estimates. The 2013 version is also released. It is based on the integration of three data sources:
- Five-year estimates from the American Community Survey by the U.S. Census Bureau http://1.usa.gov/1R2diIW
- The 5M version of the Cartographic Boundary Files for the Congressional Districts under the 114th Congress by the U.S. Census Bureau http://1.usa.gov/1Ob1qxI
- The 114th Congressional Directory of Representatives by the U.S. House of Representatives http://1.usa.gov/1LVWjzt
Notes
- The average population size of a Congressional District is about 710,000 according to the 2010 census
- Congressional District boundaries may be changed by state legislatures and sometimes challenged in court
- The American Community Survey (ACS) produces two sets of estimates – 1-year and 5-year. Updates are typically released in December
- The Asian American subpopulation estimates are based on one race only; it does not include two or more races
- Due to demographic, election, and geographic changes, the map will also change over time; it will be updated as needed
- Follow us on Facebook, Twitter, and LinkedIn for the latest updated maps


